Reporting and Dashboard
e-Maintain empowers teams and decision-makers with reporting and dashboard engine, designed to deliver actionable insights and operational visibility across all levels of the organization.
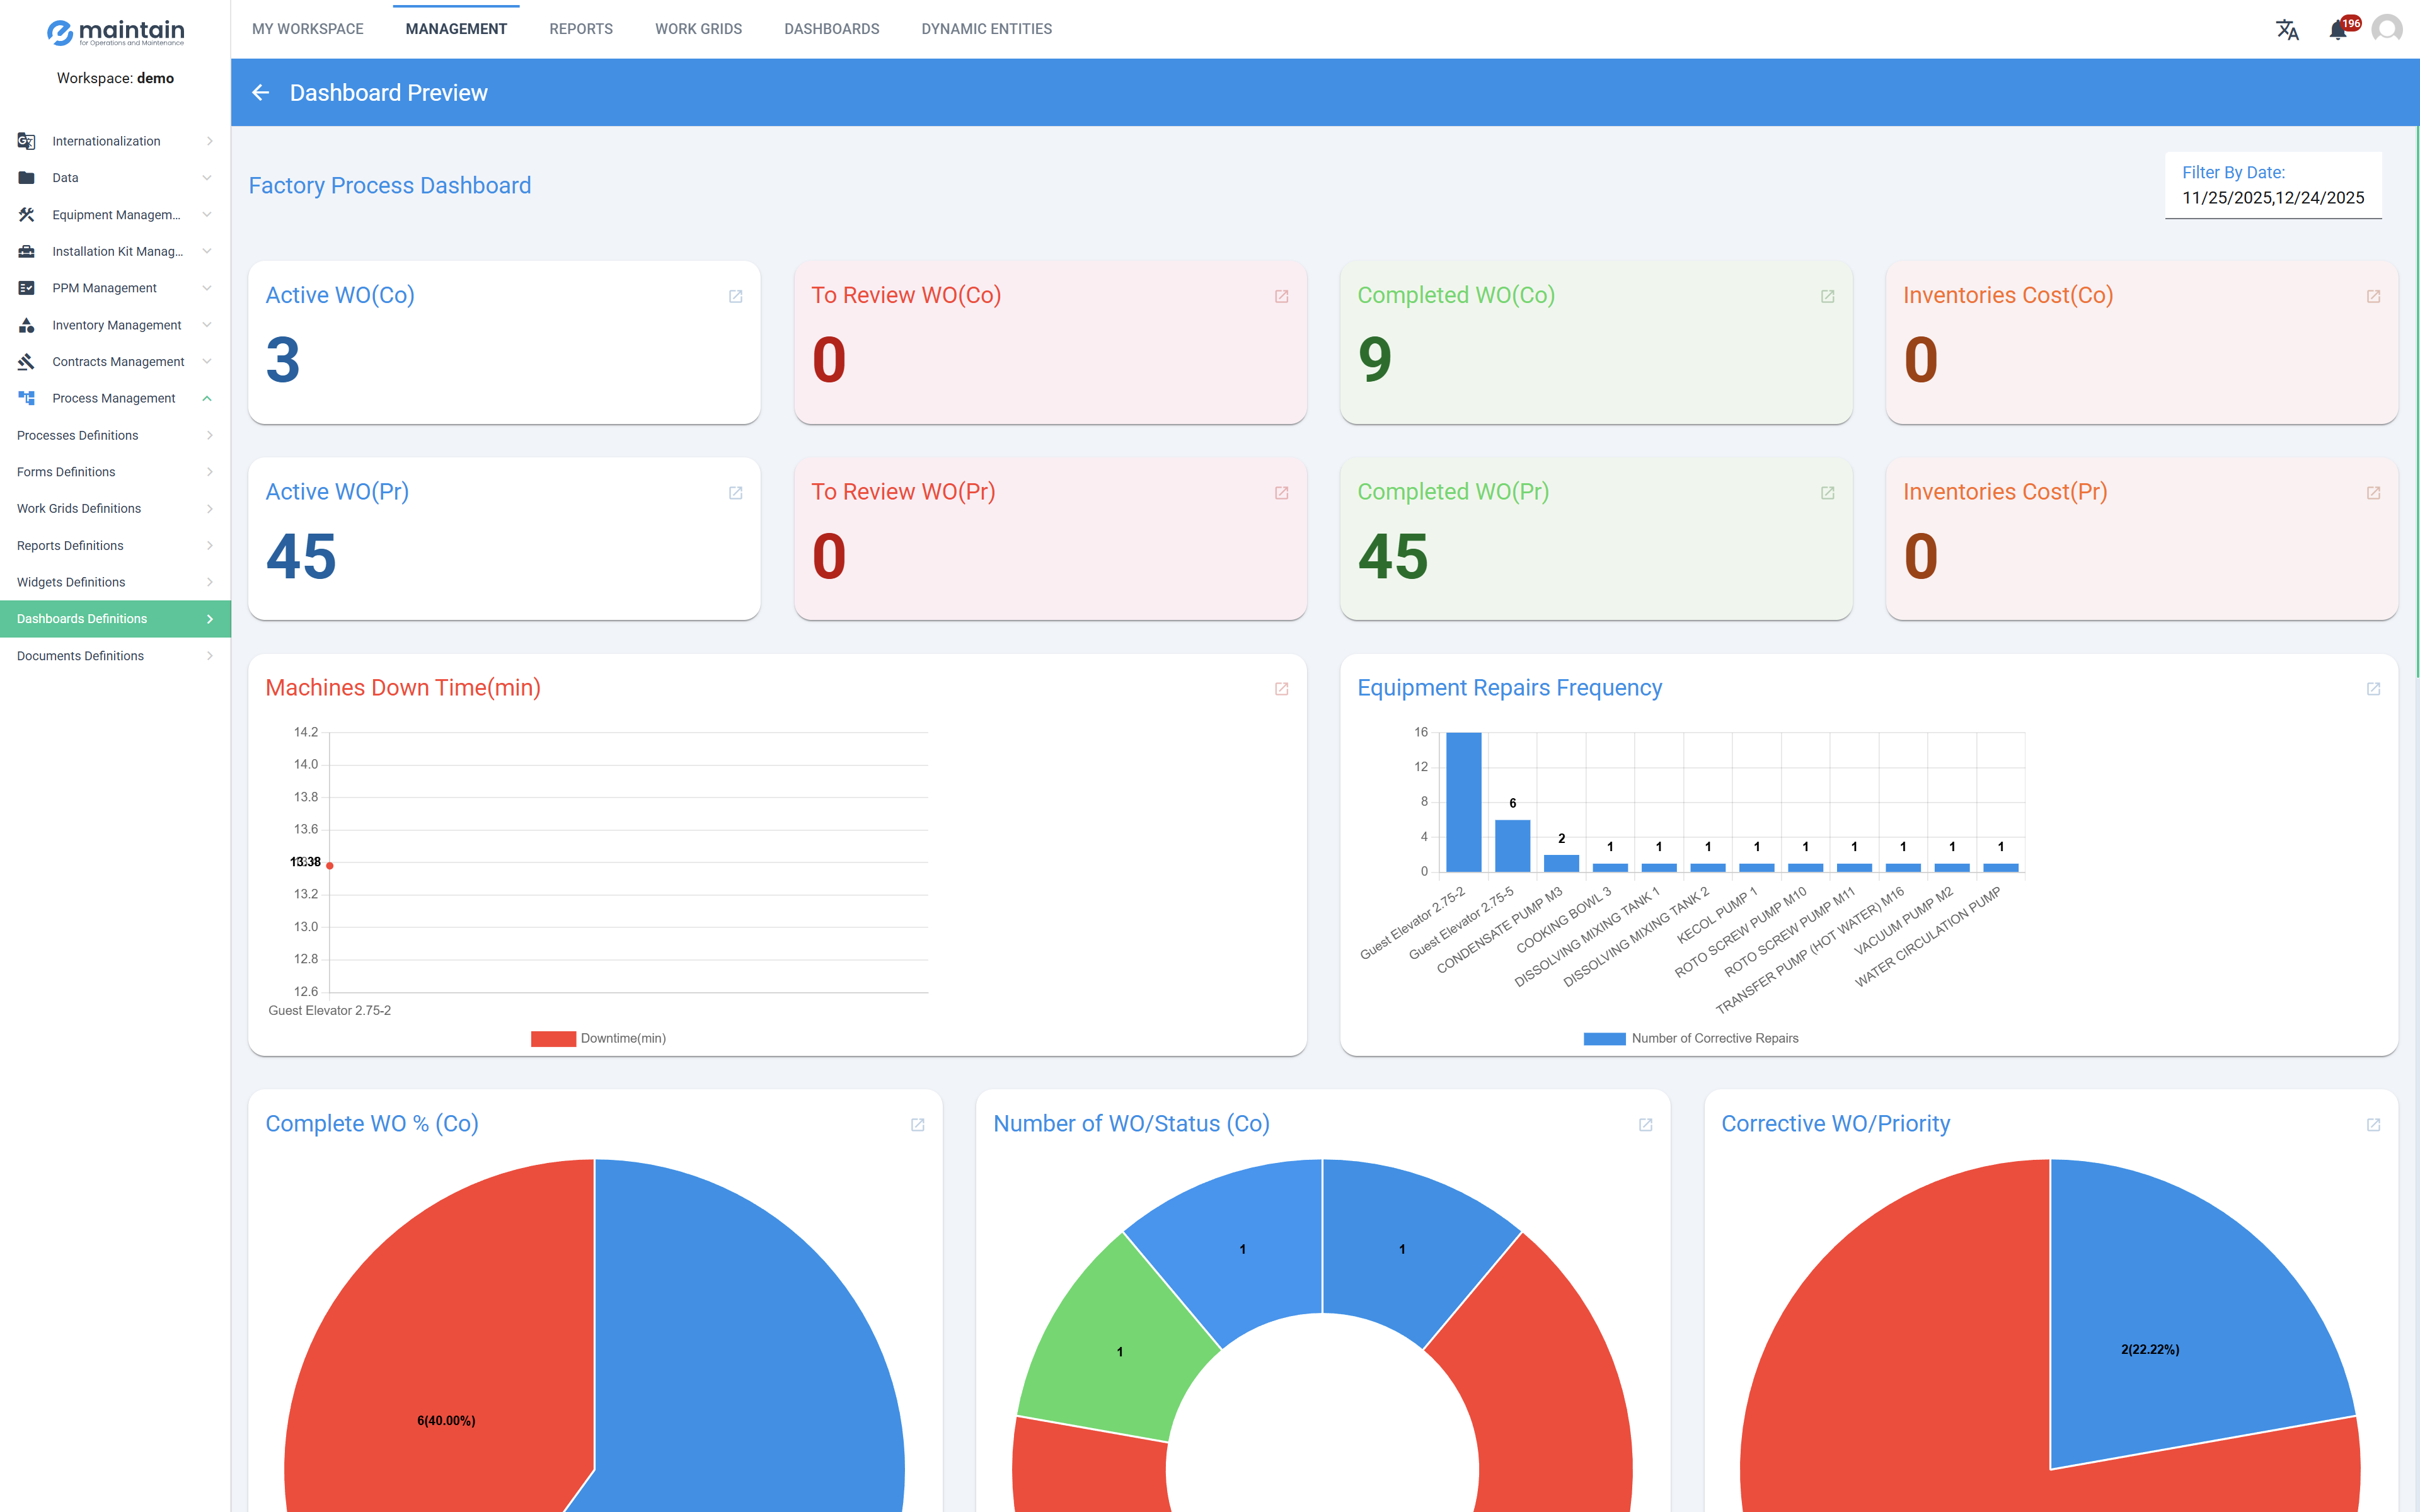
e-Maintain empowers teams and decision-makers with reporting and dashboard engine, designed to deliver actionable insights and operational visibility across all levels of the organization.
The integrated report builder enables users to easily generate customized reports by selecting relevant data fields and applying aggregation functions such as totals, averages, counts, and more. This tool allows technical teams, operational units, and senior management to extract meaningful insights tailored to their specific needs, without requiring advanced technical skills.
The dashboard builder features modular, interactive gadgets that retrieve and visualize data from multiple sources in real time. Users can choose from a variety of widget types (Single Value Displays, Tables, Line Charts, Area Charts, Bar Charts, Pie & Donut Charts, Polar Charts). Each widget is fully customizable, offering teams the ability to monitor KPIs, performance indicators, and operational metrics at a glance.
The module includes comprehensive permissions management, allowing organizations to define who can view, edit, or share reports and dashboards. This ensures that every team from field technicians to C-level executives has access to the data they need, while maintaining information security and role-based governance